Registered with the Registrar of Newspapers for India under R.N.I 53640/91
Vol. XXVII No. 15, November 16-30, 2017
Population profile and policy priorities
by A Special Correspondent
Graduating from elementary needs of roti, kapda and makaan, health and education seem, today, to emerge as the next priorities in Tamil Nadu, analysing data about the State’s population. Substantially higher investment and expert design for high effectiveness on these two sectors seem to be the direction in which progress lies and not in give-aways and write-offs. Just these two projects might be enough to engage the whole five-year term for doing a good job of it. And even to win votes.
First, some background to understand the data.
The probability of India having the world’s largest population of working age by 2027, a billion strong, was recently pointed out in the Press. As it is, half the country’s population is under the age of 25. Two-thirds are less than 35. The demographic profile of the country is not uniform through all regions as fertility and longevity across regions are not uniform. Focusing on Tamil Nadu, the implications of the demographic profile for policy makers is examined a few paragraphs down.
By and large, fertility rate and mortality rate (longevity) govern the demographic composition of a given region. Fertility rate is the number of children born per woman – it is 2.4 for India. Fertility rate is reduced by gender preference favouring the male birth which, over time, lowers the ratio of women to men. Lack of education among women, poverty and general illiteracy tend to increase fertility level. Because of the interplay of these factors, there are variations of fertility rates across the country.
Assuming that the aim is to maintain population at current strength, births should be equal to mortality rate. Lower the mortality, higher is longevity and, therefore, the lower is the fertility rate needed to maintain population. This is referred to as the replacement rate. In urban India, the fertility rate is 1.8 – well below the overall replacement rate of 2.1 for the country to keep the population constant. When the policy aim is to curb population growth, the fertility rate needs to be brought down through awareness campaigns, investment in women’s education and incentives for smaller families. India’s well-known campaign of “We Two, Ours One” and the tax breaks and direct financial supports extended by European countries are examples of governmental interventions to influence the fertility rate.
The interplay of fertility rate and longevity cannot be over-simplified as it not only affects population numerically but alters, over time, its age-wise composition. For USA and India, for example, the mortality rates are 8.15 and 7.2 respectively, India looking as doing better, but the essential difference is that mortality in a country with weak health services takes its toll across age groups affecting even the younger groups. In a country with good health services, mortality prevails more in the senior age groups. After all, mortality cannot be avoided! Trying to influence the fertility rate to mortality rate drove countries to limit family size with unexpected adverse consequences on the very means for attaining higher living standards. They found themselves confronting disproportionately large numbers of senior citizens needing social welfare support as compared to the economically productive part of the population who bear the cost of social welfare directly or indirectly by contributing more taxes to the state.
In a manner that is easy to appreciate, the demographic profile and its significance to policymaking can be graphically visualised by constructing a Population Pyramid as illustrated in Guru Prasad’s portal. The pyramid is a simple depiction of the number of men and women of different ages by bar lines – X axis representing numerical population and Y the age groups – one side of the graph for men and the other for women.
An Egyptian pyramid typifies the situation of poor and developing countries in which the base layers representing the younger people are longer than the shorter top representing the aged but contracting rapidly layer by layer – the formation being the effect of high fertility rate and high mortality rate. The contrasting picture would be almost like a top overhanging pyramid or a mushroom-like formation in which the bottom layers of younger part of the population are narrower that the wide top layers of the old – indicating low fertility rate and high longevity characteristic of many Western countries. The ideally balanced situation would produce a bell-like curve.
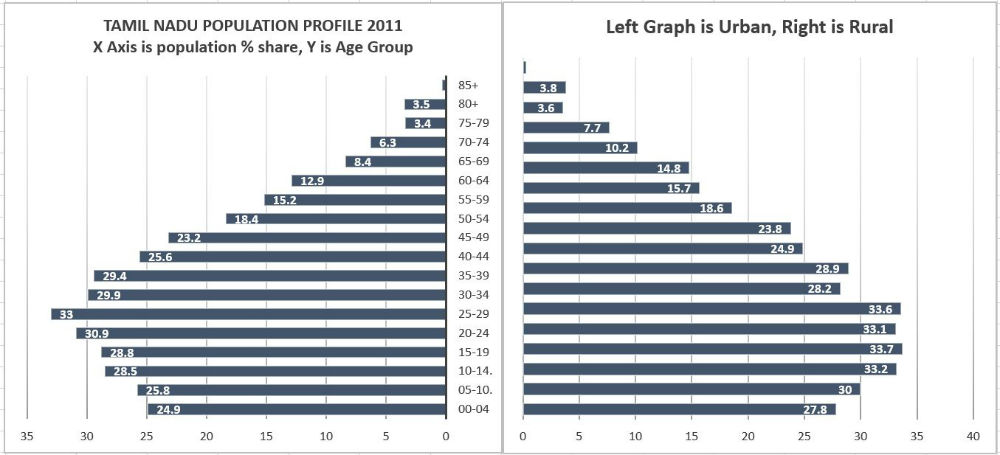
With this background, we can make use of the pyramid model to see what policy indications could be derived from Tamil Nadu’s population composition, see figure of pyramidal graph for Tamil Nadu (source of data:
www.tn.gov.in/dear/State%20Income.pdf). Population analysis by age groups of five years is unavailable categorised by gender but available for urban and rural sectors which has been used for constructing the pyramid. The readings are only for quick broad appreciation.
If age 20 to 64 is considered as constituting the work force it is seen from the graph that it is together a substantial mass accounting for approximately 60 per cent of the total population. From age 30 to 64 the bar lines are rapidly shortening as they move up the ladder indicating that they are declining in numbers, possibly due to mortality. It must be said, however, that Tamil Nadu has done well in controlling infant mortality through pre-natal and neo-natal care, but the young working age groups are affected by mortality. Such a loss to a potential economic force does not speak well of the healthcare services. In >65 age groups, the declination continues and the typical accumulation of aged people in the top part of the graph, due to longevity, is not in evidence.
The Tamil Nadu pyramid is still the typical pattern of poor, developing countries that are caught in a low longevity cum high fertility rate situation. High fertility supplies the working force in the face of poor health and early mortality. Poor sanitation, want of safe drinking water and neglect of women’s health are factors that account for the low longevity that cuts right across age groups as seen from the graph. Good health services within the grasp of the poor and middle classes and logistically within easy reach of the interior are the Right of society.
With more efficient public health support, the youthful productive group of age 20-44 would not have been declining but would have cumulated to 45 per cent instead of the present 40 per cent (appx.) as in the graph. A large youthful population represents only a potential. The so-called demographic dividend is not automatic. To realise the dividend, substantial investment on education and vocational training is needed besides creating self-employment opportunities and encouraging knowledge of more than one Indian language to be able to avail of wider opportunities. The state of Uttar Pradesh, with a population somewhere between that of Nigeria and Brazil, has a fertility rate close to 3; neighbouring Bihar, which already has 100 million people, has a fertility rate of 3.3.
These are precisely the parts of India that are poor in social services and, because of weak infrastructure, not integrated with the country’s economy. Tamil Nadu’s workforce must be trained to fill higher technical and skill oriented jobs and not remain in competition with the unskilled labour from poorer states. Youth may have degrees, but are still unemployable for want of social, articulation and job-specific skills. Indiscriminately producing degree holders bereft of qualities that make for employability only leads to structural unemployment – jobs available, but no suitable candidates. At one time, the state was known for high standards of education.
Ironically, the political class, instead of improving our education system’s competitive ability, is agitating for lower entry thresholds.
As both the urban and rural sides of the pyramid are symmetrical there is no sign of imbalance between the major social sectors of the economy. However, what the graph (which is for 2011) signifies seems to be at variance with episodic evidence. Youth are reported to be flocking to cities looking for opportunities or attracted by lifestyle facilities. Although this may not be significant today, it is prudent to act in advance and introduce mechanisation in stages to avoid manual drudgery in agricultural operations, make farming remunerative and take amenities to villages to make rural living enjoyable.